system monitor
updated
CPU and GPU load and temperature, memory and swap, network, disk, battery health and power draw – live values with sparkline charts, color thresholds you set yourself, °C/°F, and an uptime line. Readings come straight from macOS and update only while the tab is open. The memory row also speaks up when a lot of memory has gone to disk, and not only when macOS itself reports being short.
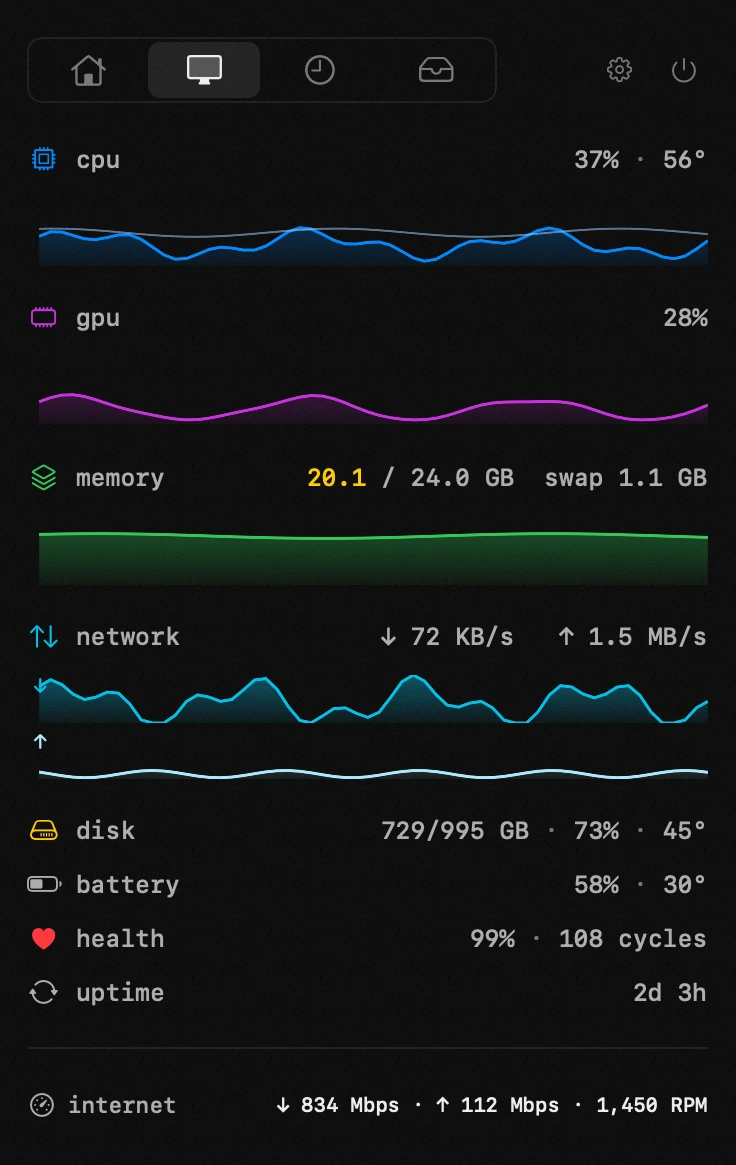
- cpu – processor load and the hottest spot of the chip. on Apple Silicon the die sensors are shared between CPU and GPU, so a separate GPU temperature is often unavailable.
- gpu – graphics load.
- memory – used/total, counted like Activity Monitor.
- network – current speed: ↓ download, ↑ upload.
- disk – used/total, percentage and SSD temperature.
- battery – charge and temperature. health – capacity left versus factory (95% = the battery holds 95% of new); cycles – full recharges.
- power – adapter wattage plus current charge/draw. the charge figure below the adapter's rating is normal: part of the power runs the Mac itself, the battery gets the rest, and past ~80% the charge current tapers on its own to protect the battery.
- uptime – how long the Mac has run since the last reboot.
value colors: white or green – fine, yellow – heavy load, red – critical. thresholds for temperature, load, disk and battery are set in settings, along with °C or °F.
- graphs – the switch in monitor settings turns rows into live charts: a filled area under each row shows how the value changed over the chosen time window.