system monitor for your Mac's menu bar
updated · by Anton Shakirov
the fans are loud and you want to know why. hop keeps load, temperatures, memory, network, disk and battery in one menu bar panel, and stays quiet until one of them leaves the range you decided was normal. some of those numbers macOS gives you for free; the temperatures it does not give you at all, and this page is straight about which is which.
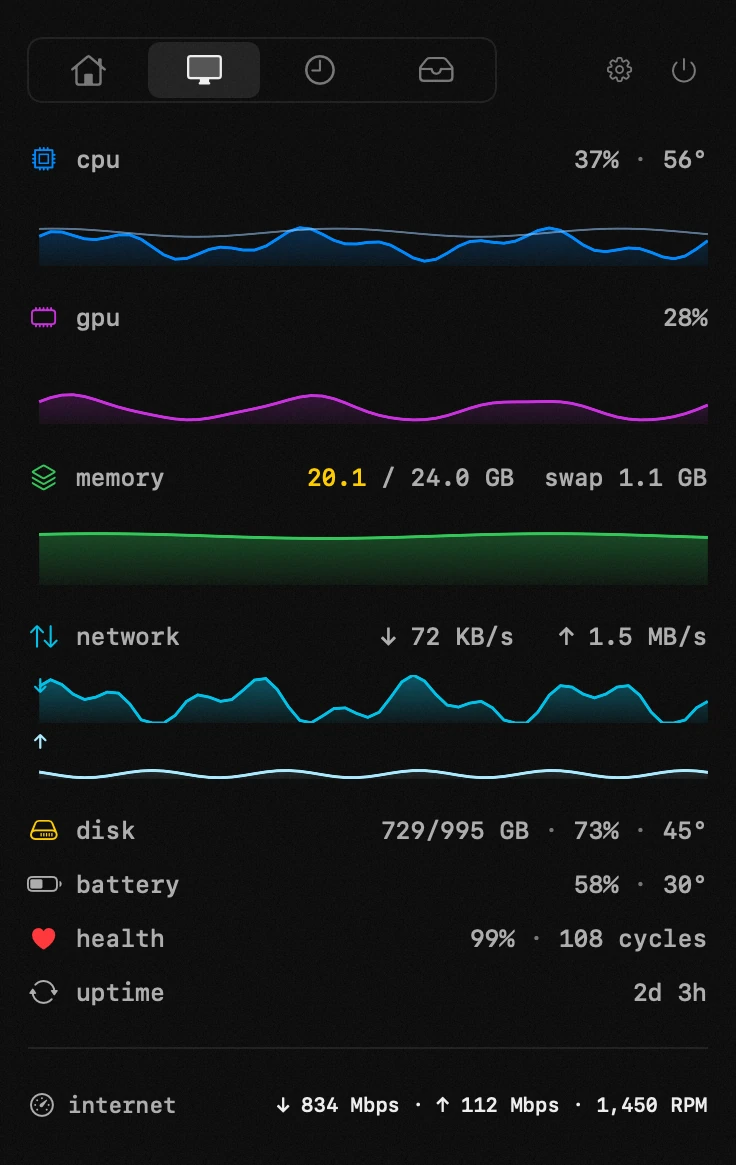
| what it is | system monitor inside hop, a menu bar app for macOS |
|---|---|
| price | free — no trial, no pro tier, no account |
| licence | MIT, source on GitHub |
| requires | macOS 14 or later, Apple silicon or Intel |
| works offline | yes |
| data sent anywhere | none |
what a menu bar system monitor watches
- cpu and gpu load, with temperatures beside them
- memory, including how much of it has been pushed to disk
- network activity, up and down
- disk activity
- battery health, cycle count and current power draw in watts
- uptime
every row is live, with a sparkline for the last hour, °C or °F as you prefer, and colour thresholds you set yourself.
the temperature row is the one people come for, and it has a page of its own with the commands that do not work and the one that does: check cpu temperature on an Apple silicon Mac
what your Mac already shows without a system monitor
Activity Monitor is a window, not a menu bar readout
load, memory, energy, disk and network are all in Activity Monitor, free, on every Mac, and for a one-off question that is the answer. it holds one thing back: it is a window you open, look at and close, and a number you have to go and fetch is a number you fetch after the machine has already been slow for an hour.
it can put a live graph in the Dock: View → Dock Icon offers cpu usage, cpu history, network usage or disk activity, one at a time, in the corner you are least likely to be looking at.
what each tab actually measures, from Apple rather than from a listicle: view cpu activity in Activity Monitor — Apple Support
the temperature commands people copy do not exist here
on macOS 26.6.2 on Apple silicon, `powermetrics --samplers smc` answers `unrecognized sampler: smc`. it is not that the sampler returns nothing — argument parsing refuses it before anything runs, and sudo changes nothing about that.
the supported list, straight out of `powermetrics --help`, is `tasks, battery, network, disk, interrupts, cpu_power, thermal, sfi, gpu_power, ane_power`. there is no temperature sampler in it, and `thermal` is described as «thermal pressure notifications» — levels, not degrees. `sysctl -a | grep -c -i therm` returns 0 keys, and `ioreg` lists a temperature sensor node for the ssd while handing over no value.
so the short answer most pages step around: on an M-series Mac no supported command prints a cpu or gpu temperature, because the facility those recipes were written against was an Intel one.
the one thermal answer macOS does give you for free
`notifyutil -g com.apple.system.thermalpressurelevel` prints a level immediately, with no sudo and nothing installed. it is the same signal apps get, it settles «am I thermally stressed right now», and almost nobody in the search results mentions it.
two more, for completeness. `pmset -g therm` exists but on an idle M-series machine answers «not recorded» three times over — it fills in after a thermal event, not before. and the only real temperature the system publishes is the battery's: `ioreg -rc AppleSmartBattery | grep Temperature` gave 3091 here, which is 30.91 °C.
the same signal in the form applications receive it, which is why no app can show you a «truer» number than this one: ProcessInfo.ThermalState — Apple Developer
and why the industry moved from degrees to pressure levels in the first place, if you want the reasoning: power and thermal management on Apple silicon
if what sent you here was noise rather than numbers, the fan is answering a question of its own: why your Mac fan is loud
so do you need a system monitor at all
for a single question asked once, like what is eating the cpu this minute or how much memory is left, Activity Monitor and one line of Terminal cover it, nothing needs installing, and that case is most of them.
the simple case ends at three points: when you want degrees rather than a stress level, when the question is «has this been building up» rather than «what is it now», and when you want to be told without asking. macOS answers none of the three, and that is the whole reason this class of app exists.
how hop's system monitor reads temperature and load
hop keeps cpu and gpu load with their temperatures in the panel, next to memory and swap, network, disk, battery health and cycles, power draw and uptime. a hot chip and a busy one sit side by side, so they are told apart rather than guessed at.
each row carries the last hour as a graph, and that is what turns a number into a diagnosis: the fans spun up two minutes ago, and the graph says whether that was an export finishing or something climbing since lunch.
| what you want to know | the built-in route | with hop |
|---|---|---|
| am I thermally stressed right now | notifyutil, one line, free | not needed for this alone — use the command |
| how hot the cpu and gpu actually are | not available — no command, no sudo, no ioreg value | shown in degrees, beside their load |
| is it climbing, or was that one spike | no history in any built-in tool | the last hour as a graph on every row |
| how much memory has quietly gone to disk | vm_stat and sysctl, if you know the fields | a row that speaks up on its own |
| tell me without my asking | nothing to notice on your behalf | the menu bar icon carries the warning |
| what counts as normal for this machine | no thresholds to set anywhere | you set them per row |
the first row is the honest one: if the question is binary, the command settles it and there is nothing to install. the rows under it are where the built-in route has nothing at all, and the second one is not «harder» — it is absent.
the network row answers «is it me or the connection» only up to a point, and the module next door takes it the rest of the way: internet speed test for Mac
quiet until a value leaves the range you set
a monitor that shows eight numbers at all times stops being read after a week. it becomes wallpaper, and you learn about overheating from the fan noise like everybody else.
so values stay calm and light up only when they leave the normal range, and the warning can sit on the menu bar icon itself, where you notice it without opening anything.
what counts as normal is yours to set. a machine that renders video all day has different thresholds from one that writes email, and a monitor flashing red all day on the first machine is worse than none.
does a menu bar monitor slow the Mac down
a monitor that shows up in its own readings has failed at the only thing it does. hop stays out of its own graphs: readings come from macOS rather than from polling hardware, and they are taken while the tab is open rather than around the clock.
and if the icon itself is the problem — a laptop with a notch runs out of menu bar long before it runs out of things to show: menu bar icons behind the notch
the memory row, and the warning that arrives early
macOS reports memory pressure and it is a fine number, except that it stays green while your Mac quietly moves gigabytes onto the disk. by the time pressure turns yellow, everything has already been slow for a while.
the second catch is easy to walk into: that coloured level exists only inside Activity Monitor's window. `/usr/bin/memory_pressure` in Terminal prints counters and a free-percentage line and no green, yellow or red at all, so «check it from the command line» is advice that does not survive being tried.
hop's memory row warns when a lot has gone to disk, not only when the system says it is short. that is usually the real reason a Mac feels sluggish with plenty of memory apparently free.
Apple's own description of the memory tab says what it counts and never mentions the colours at all: view memory usage in Activity Monitor — Apple Support
what the pressure gauge is actually measuring, once you stop reading it as a fuel gauge: what memory pressure actually measures
and the message at the end of the road, with the steps that clear it: «your system has run out of application memory»
what a menu bar monitor will not do for you
- it does not name the process. a row says the cpu is at 90 %; Activity Monitor's cpu tab says which app is holding it there, and that is the tool for that question.
- it does not control the fans. a Mac that is loud at a constant speed under no load is a service question rather than a software one.
- it does not keep a week of history. the graphs cover the last hour — «what just happened», not «what has this machine been doing since Tuesday».
- it does not make a hot Mac cooler. these chips are designed to run hot and to slow themselves down before anything is at risk; a high number on its own is not a fault.
- it does not explain disk space. a disk row shows activity, not what is filling the volume up.
that last one has its own answer, and «System Data» is where most of the confusion lives: find out what system data is using
frequently asked questions
- does it show cpu temperature?
- yes, next to cpu load, and the same for the gpu. macOS itself offers this nowhere — not in Activity Monitor, not in System Information, and not from any supported command.
- why doesn't the powermetrics command show temperature?
- because the sampler it asks for does not exist on Apple silicon. `powermetrics --samplers smc` answers «unrecognized sampler: smc», and temperature is not in the supported sampler list at all. those recipes were written for Intel Macs.
- is there any free way to tell if my Mac is overheating?
- yes, one: `notifyutil -g com.apple.system.thermalpressurelevel` prints the current thermal pressure level without sudo. it tells you whether the system is under strain — not how many degrees, and not what it was ten minutes ago.
- can it warn me without opening the panel?
- yes. the menu bar icon itself can carry the warning, so you notice at a glance rather than by remembering to look.
- can i decide what counts as normal?
- yes, the thresholds are yours, per row. a machine that renders all day should not be flashing red all day.
- does it show battery health?
- yes: health, cycle count and current power draw in watts, alongside uptime.
- does monitoring slow the Mac down?
- it is built not to. readings come from macOS rather than from polling hardware, and they are taken while the tab is open. a monitor that appeared in its own graphs would be a poor one.
other tools in hop
- app launcherthe apps you open all day, one click away.
- text recognitionpull text off anything on screen — a video in Chrome or VLC, a locked pdf, another app's window.
- archiveszip, rar, 7z and the rest — unpacked right where you are looking.
what people do with this
what people pay for this
| app | price | what you get instead |
|---|---|---|
| iStat Menus | $11.99 one-time | load, temperatures and battery health without the licence. |
| Stats | free, open source | quiet until something leaves the range you set. |
| hop | free, MIT | load, temperatures, memory and battery — quiet until something is wrong. |
prices checked at the vendor's own page on 2 september 2026
about the author

Anton Shakirovmakes hop
makes hop and every page on this site. eighteen tools under a single menu bar icon, MIT licensed and open source. reads and answers issues and email himself.